


Statistical Process Control in Six Sigma
Digitize Improvements, Quality, Safety, Maintenance, and more
Statistical Process Control, or SPC, applies statistical methods to monitor and control a process, so it will operate to its full potential to produce product(s) as specified.
Some of these terms deserve to be clarified:
- "Statistical methods" means that results must be measured, recorded, and analyzed
- "Monitor" refers to taking measurements
- "Control" means taking corrective action when required
- A "process" is a documented and controlled method for changing inputs into output products; the process may involve a machine that makes widgets or a set of rules for an accountant or a masseur
- To "operate to its full potential" refers to productivity: to meet its standards for producing output
- To produce "product(s) as specified" means that there is a specification that the products must meet
Therefore the goal of SPC is to ensure a process operates to its capacity and also produces defect-free products. SPC uses statistics to monitor and control the process.
Several different quality programs use various forms of SPC. In the context of a Six Sigma-oriented company, monitoring is regular operational activity, and the defect rate is well defined. The nominal defect rate is at 3.4 defects per million opportunities, also known as "achieving a Process Sigma of 6".
An Example of SPC in Manufacturing under Six Sigma
One simple process is a machine that cuts a solid metal rod into shorter bolts.
The company's Six Sigma orientation has ensured that the specifications and operating guidelines are complete and realistic. The process – the machine – is rated to produce one bolt every second, with a tolerance of producing 57 to 64 bolts per minute. The output has clear specifications for length, diameter, whether the edge should be rough or smooth, etc. This example will focus only on the length, which has the three specified values: the minimum acceptable length; the maximum; and the nominal or desired length.
SPC requires taking measurements. This example discusses measuring the machine's throughput and the length of the bolt it produces.
One concern in statistics is "sampling bias". If measurements are always taken under the same conditions, then the samples are biased. For example, if the bolt is measured only when the machine is first started, a problem caused by the heat of friction after the first hour would be overlooked.
To avoid "sampling bias", observations should be made at different times and under different conditions. For example, take an observation:
- When starting to use a new batch of input rods
- When starting the machine after maintenance
- When starting the machine at the start of each shift, including days, nights and weekends
- At different times during each shift
How many samples should be measured? With the above machine, one approach may be:
- Take a sample at the start and end of each 8-hour shift, and also once an hour
- Pick a sample output bolt and start the stopwatch
- Count the output bolts for one minute
- Pick three output bolts during that minute
- Pick the output bolt produced at the end of that minute
- Each 8-hour shift would therefore record 10 observations of 5 bolts each, for a total of 50 bolts
Produce control charts showing:
- Number of bolts per minute: there is one number per row on this chart
- Length: there are five numbers (one per bolt) for length
The "length" chart is pre-printed with the nominal or desired length, as well as the minimum and maximum acceptable lengths. The inspector logs the length of each sample bolt on the row; calculates the average; and notes the range, the difference between the minimum and maximum, in that row.
At the end of the shift, the inspector calculates the average of the average lengths, as well as the average of the range of lengths, from the above rows.
The table would include this information:
|
Min: 0.9 |
Max: 1.1 |
Nom: 1.0 |
|
|
|
|
Date/ |
Bolt 1 |
Bolt 2 |
Bolt 3 |
Bolt 4 |
Bolt 5 |
Avg |
Range |
#1 |
0.98 |
0.99 |
1.02 |
1.02 |
0.99 |
1.000 |
.04 |
#2 |
1.02 |
0.99 |
1.02 |
.96 |
1.02 |
1.002 |
.06 |
(etc.) |
(etc.) |
(etc.) |
(etc.) |
(etc.) |
(etc.) |
(etc.) |
(etc.) |
#10 |
1.02 |
1.02 |
.99 |
1.07 |
1.09 |
1.038 |
.10 |
|
|
|
|
|
|
|
|
SHIFT |
|
|
|
|
|
1.022 |
.08 |
A simple quality control inspection would remove any defective bolts that are found, but SPC in Six Sigma is more concerned with the process. Therefore, once the entire table is complete, calculate the standard deviation of these observations, sigma (s):
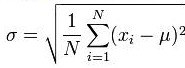
Plot these numbers on a graph, and review for trends. In this example, the average length is creeping toward the maximum acceptable value. This may indicate that a part in the machine is wearing out, and might be expected within the maintenance cycle for this machine. The range also is increasing; perhaps that is unusual and should be examined. Both the range and standard deviation are larger if the values range more widely.
Notes on SPC for a Service Process under Six Sigma
A service process may support a number of observations:
- How many act of service are provided (per hour, per shift, per employee-year)
- The number of errors reported or corrected per act of service
- The number of queries to supervisors: this may indicate systemic problems in documenting the process or training the employees, or that individuals need more training
- Customer satisfaction ratings
The same general methods are available for services as for manufacturers. Measure, analyze, and take corrective action when problems are found.
By Oskar Olofsson
Advanced Visual Management Platform
- Unleash digital power on 5S, Improvements, Safety, Maintenance, and more
- Drive success with Lean and Operational Excellence practices
- Perfectly tailored for small to medium-sized manufacturing facilities
- Experience it first-hand with our free version - Embark on your journey today!

Oskar Olofsson
Too many consulting companies see "lean" as a goal in itself.
I have never seen it that way but always think that the goal is something else. Often it is about improving productivity, sometimes being able to postpone investments or improving product quality.
What I want to offer is a holistic view where the current situation and goals are clear and where the tools from lean and other effective methods are selected and implemented thoughtfully.
Over the years, I have helped clients such as NCC, ABB, and Kopparbergs Brewery approach a world-class production.
I want to help more companies succeed! What can I do for you?
𝗼𝘀𝗸𝗮𝗿@𝘄𝗰𝗺.𝗻𝘂